Intro to DH | Summer 2021
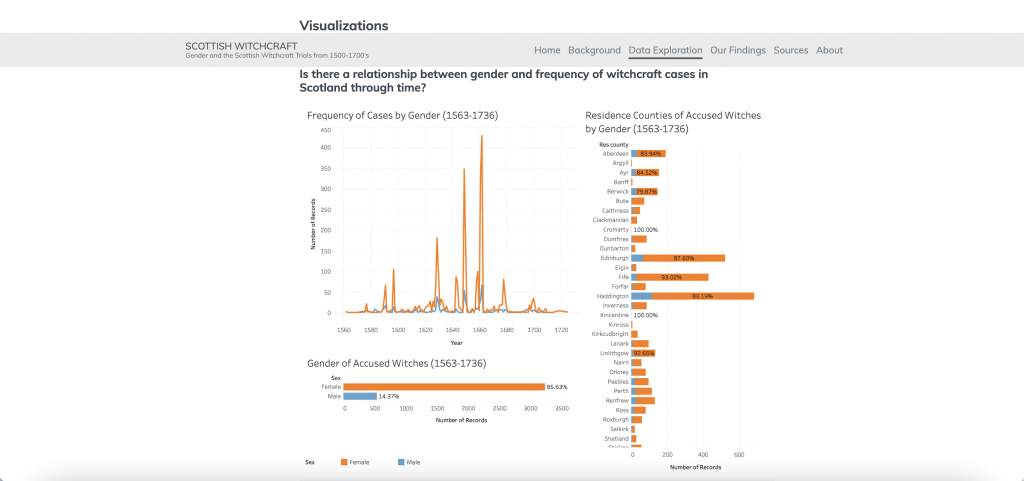
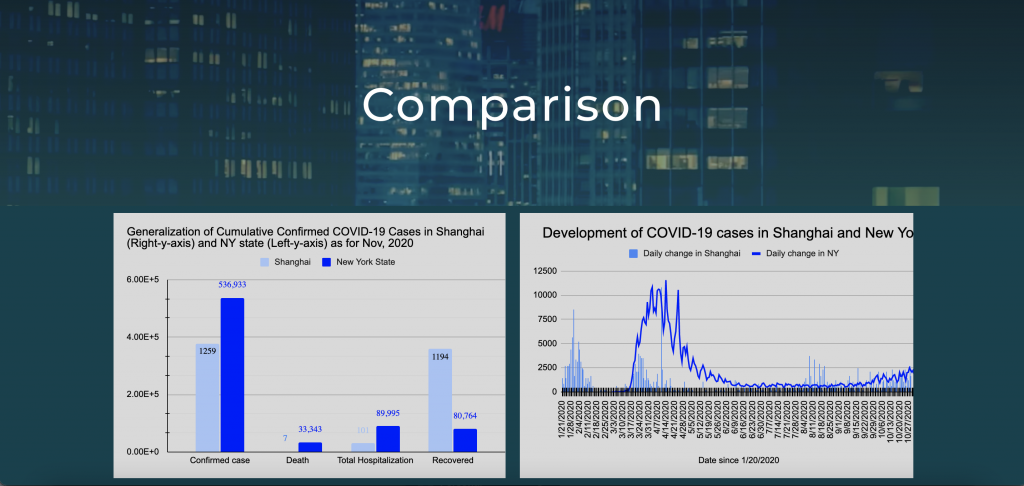
Past DH 101 Final Projects
Course Description
This course is an introduction to the Digital Humanities, its methods, theories, and applications in humanistic research. It covers a variety of digital tools and approaches to organize, explore, understand, present and tell stories with data. In this course, you will learn how to identify, use, and discuss the advantages and disadvantages of different tools and methodologies; develop strong humanistic research questions that can be answered through digital research methods; conduct original research; and build a collaborative digital project. You will also learn how to organize and clean data, develop charts, create maps, work with a content management system, and use basic text analysis tools to explore qualitative data. Often the best digital humanities projects are the result of collaboration, so you will learn how to work effectively and efficiently in teams as you build project management skills. Each unit will guide you through the development, analysis, and application of the skills listed under the course learning goals. In each unit, you will also critique examples of research projects that employ the methods and/or tools that you are learning.
Course Structure
This class will have due dates three times a week to help you keep up with readings, assignments, and project milestones. You will meet once a week synchronously with the course instructor in a whole class learning experience and once a week with your smaller lab sections; additional group work outside of the allocated class time will be necessary. We will discuss ways to organize collaborative work, as well as ways to stay on track through virtual simultaneous and asynchronous group work. No prior experience is necessary, and there are no prerequisites.
NOTE: Class will be live and synchronous Tuesdays (whole-class meeting) and Fridays (lab meeting). Technically, you could do the course asynchronously, as both sessions will be recorded every week, however it is far from ideal. The Tuesday meetings, although listed as lectures, are highly interactive hands-on workshops, and the Friday sessions give you a chance to meet with your project team. This is a project-based class, and every student will be placed in a team to learn effective collaboration and communication strategies, along with the technical skills and course concepts. Again, it can be done, but I have often seen such attempts lead to a lot of frustration among students who try it. If you think you can manage it, set up times to meet with your project team outside of class times, and are willing to drop by office hours from time to time as questions come up, then go for it, and I’ll look forward to meeting you this summer!
Overview
| Week | Reading|Viewing | Activities | Assignments | Tools & Tutorials |
|---|---|---|---|---|
| 1 | Trouillot, Silencing the Past: Power and the Production of History, ch. 1. Cartographies of Time | Concept map: data, power, silence & narrative Examine former DH 101 final projects Select teams and data set | DH 101 project analysis form Data set selection Working styles self-evaluation quiz | TimelineJS |
| 2 | Choose a recent metadata article from list. Data+Design, chs 1-2, 7-11. | Discussion post: Provide a summary of selected metadata article | Data critique Team roles & communication plan | Breve Excel/Google Sheets Open Refine |
| 3 | Klein & D'Ignazio, Data Feminism, intro & ch. 1. Weingart, "Question- and Data-Driven History," Blog. Nathan Yau, Data Points: Visualization that Means Something, ch. 4. | Discussion post: Submit a table that includes 3 research questions you could ask of your data set based on your data types, list the variable that will help you answer the question, the variable(s)’s data type, and the chart type(s) that would best represent the data types to help you answer each question. Workshop: Intro to data viz | Team Assignment: 10 research questions | RAW Graphs Tableau |
| 4 | Sanders, Visualizing History's Fragments, ch. 5. Guest lecture on humanistic mapping by Wendy Kurtz. Presner & Shepard, "Mapping the Geospatial Turn." | Workshop: descriptive statistics Workshop: simple mapping with Palladio | Data visualization assessment Research bibliography Wireframes, timeline, and 3 data visualizations for final project | How to find sources Data Visualization with Tableau Mapping with Palladio Palladio |
| 5 | Walsh & Horowitz, Introduction to Text Analysis: A Coursebook Alberto Cairo, How Charts Lie, intro & ch. 1. Turabian, A Manual for Writers, chs. 5-6. | Explore text analysis example. Workshop: Voyant Tools. Discussion post: ID a 'bad' data viz & describe why it's poor. | Mapping Assessment Annotated bibliography 1st three paragraphs of final project | Voyant Tools |
| 6 | What is DH? Data Science for Beginners "A Road Map for Data Science" | Workshop: accessible web design Discussion post: Respond to the following question - What are DH, Data Science, and the Humanities and in what ways are the three related? Project presentations in lab sections | Final project Individual reflective essay Final teammate peer evaluation | Vectr |
Sample Asynchronous Lesson
Metadata and Ethical Data Use
View: Metadata Videos
Compare and contrasts the two views of metadata presented in the videos below.
The following video was produced by Intricity, a corporate data science and management consulting group.
Let’s briefly take a look at who’s behind Intricity. The photos of the leadership team below underscore several of the arguments in Data Feminism and clearly show the effects of the decline in the number of women and other people from minoritized groups going into data analysis and computing fields.
Don’t lose heart though! This is something that we can address in our educational system, and it is our hope that UCLA’s Digital Humanities Program can be part of that solution.
Now, compare the above presentation of the concept of metadata, what it means, and how its used with the following video produced by an undergraduate student named Henry who started the Techlore channel to raise awareness about privacy and security matters online.
Who is behind Techlore?
Now, metadata is neither inherently good nor bad, but the way it is used, by whom, and for what purposes can produce dramatically different effects in the real world, as you discovered in your reading last week. In your work with a data set this term, you are also analyzing metadata, that is, descriptive information about the individual cases that make up your data set. For example, if you are exploring the LA Businesses data set, the individual cases are the businesses, and the information about these businesses, such as their name, industry category, and street address are the metadata. Consider what the metadata in your data set might reveal about the cases. Which of the many stories you could tell matter most, to whom, and why? What role do power dynamics play in how you, and others, choose to use metadata?
Activity: Discussion Post
Post either a 1-minute video or a 1 paragraph response to the prompts and questions above about the two metadata videos.