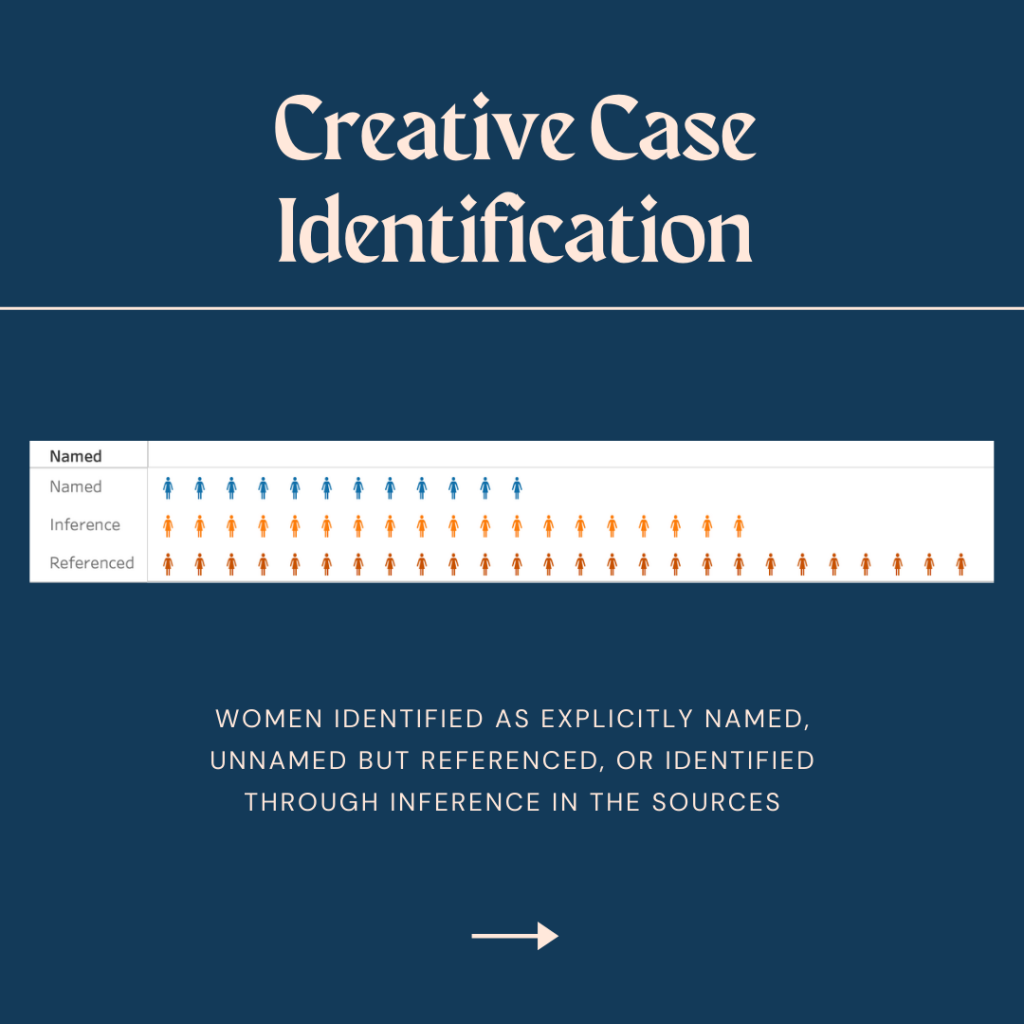
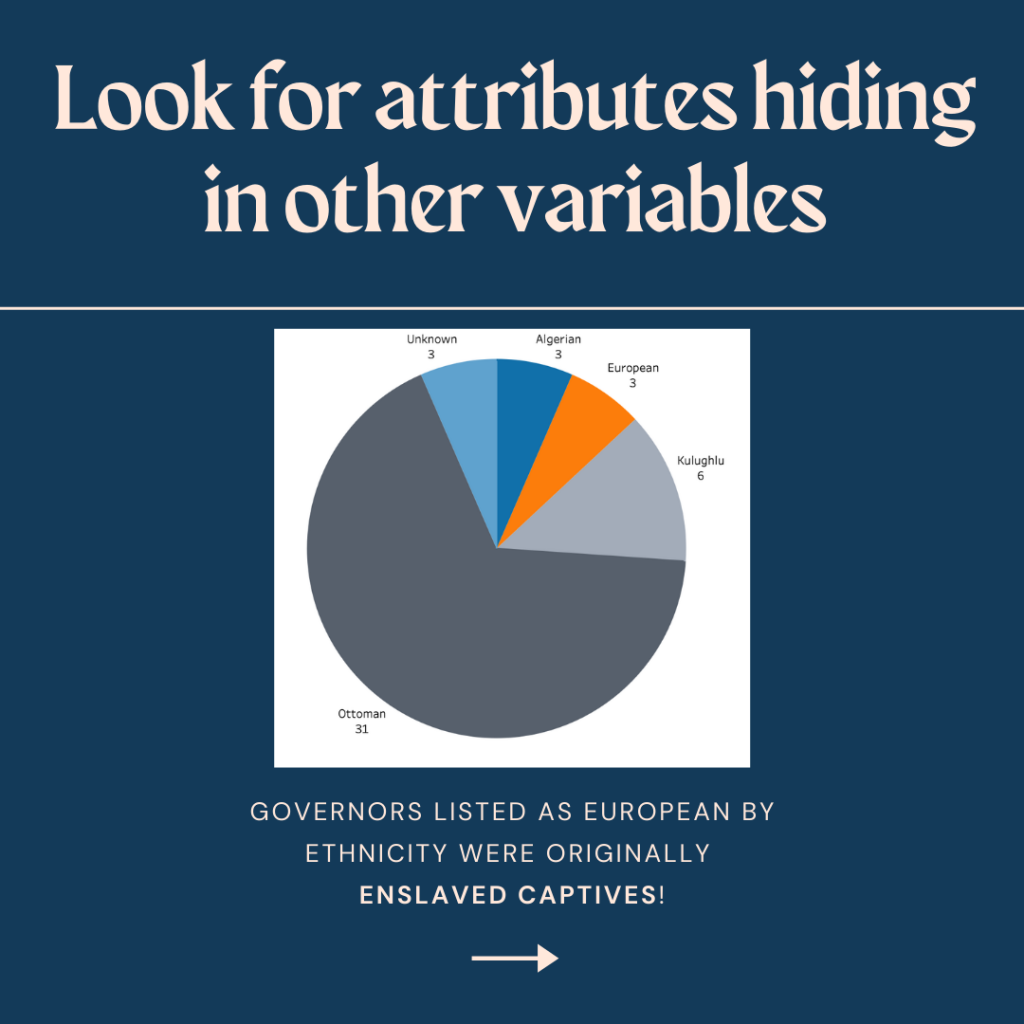
Visualizing Data Silences
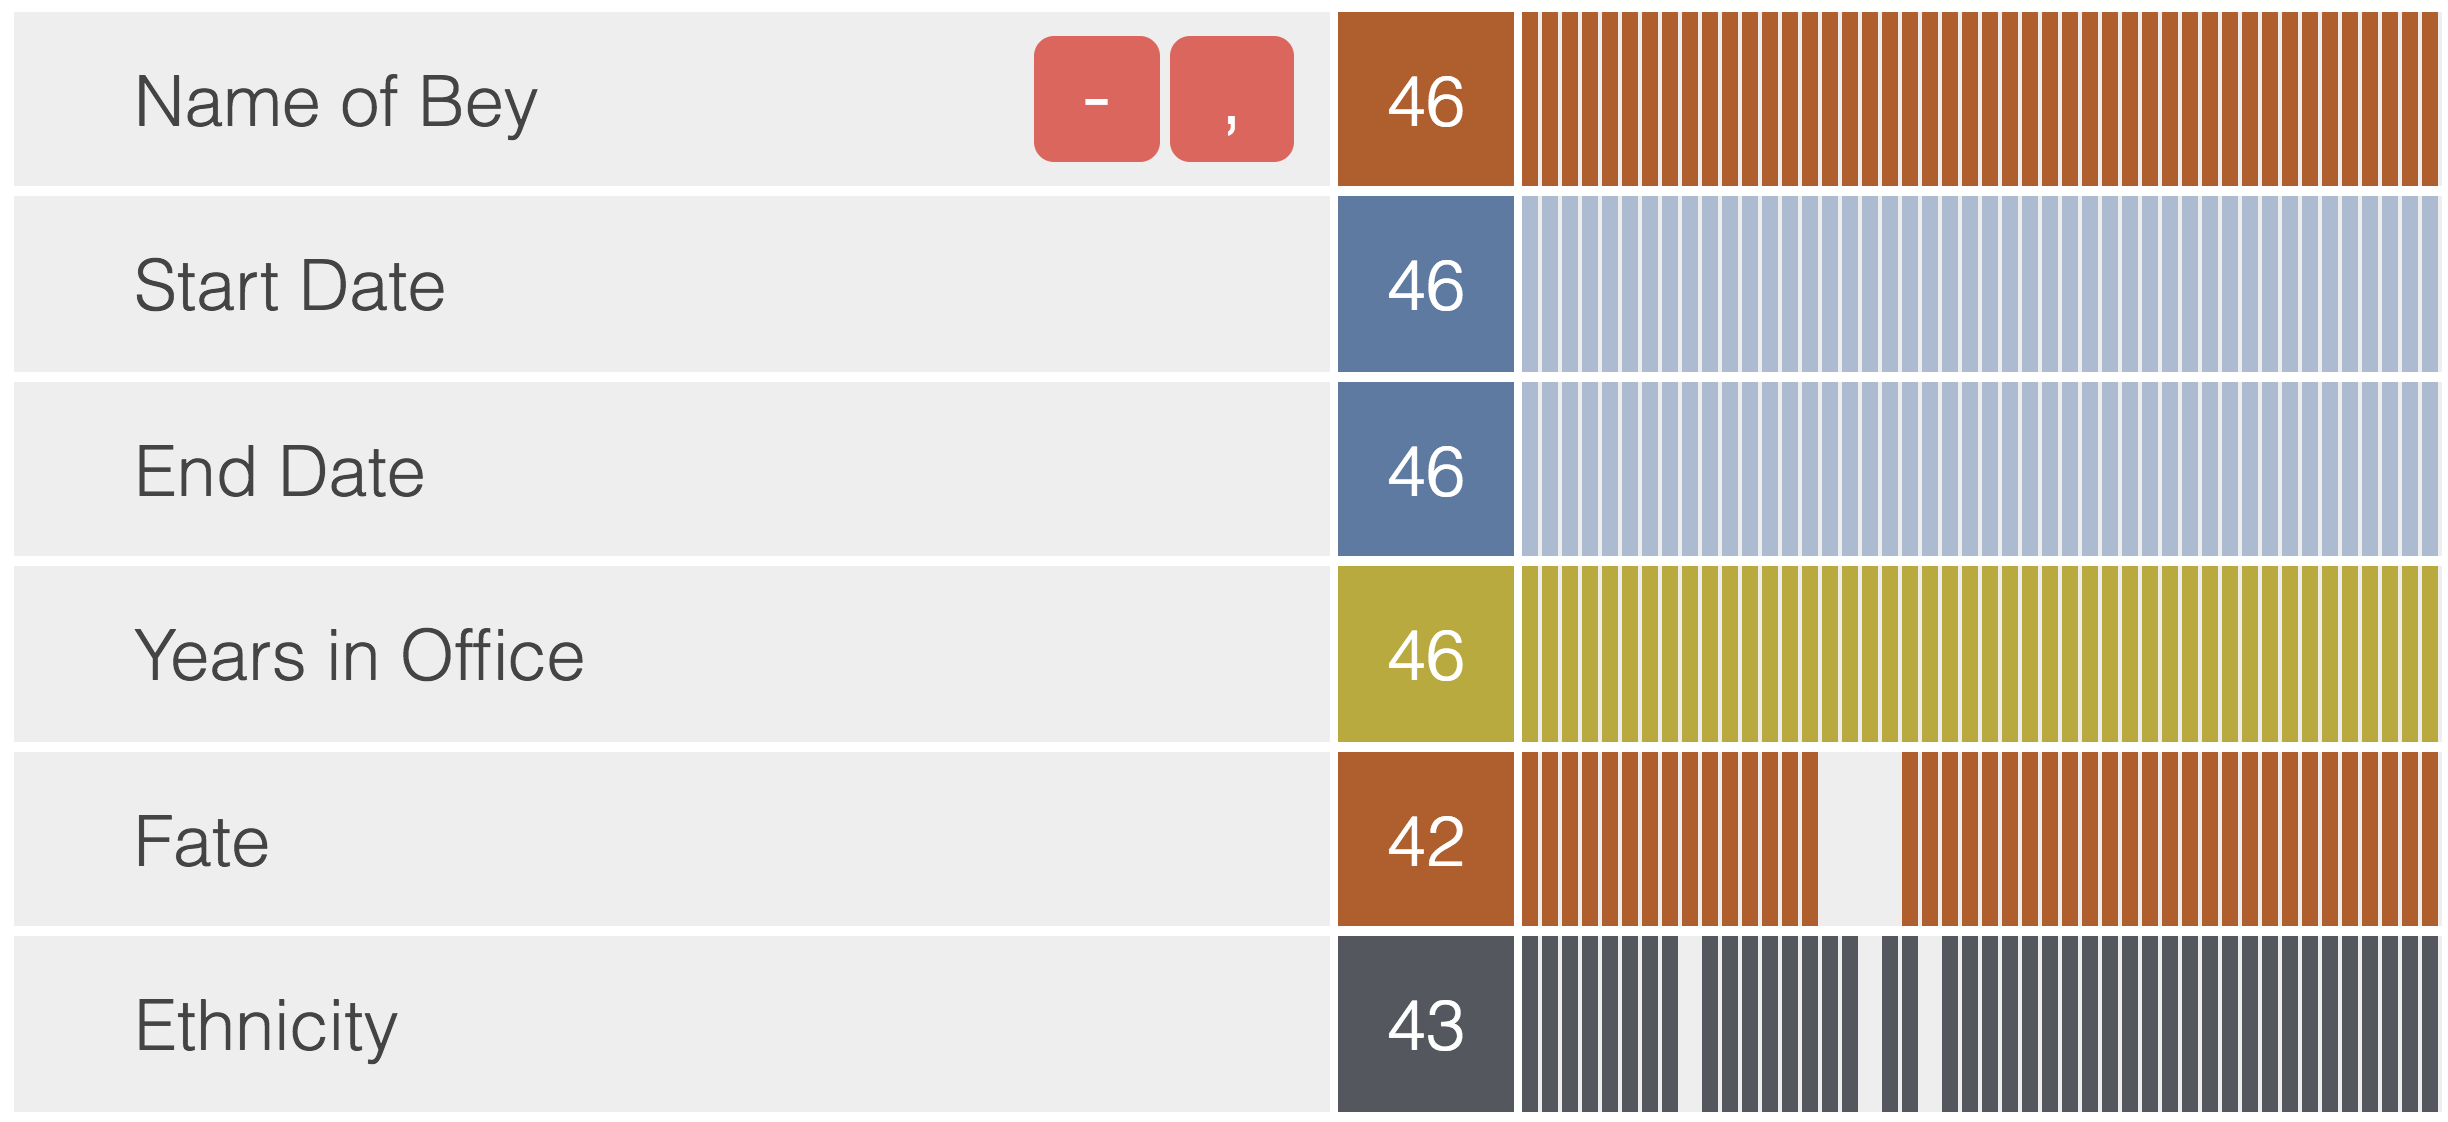
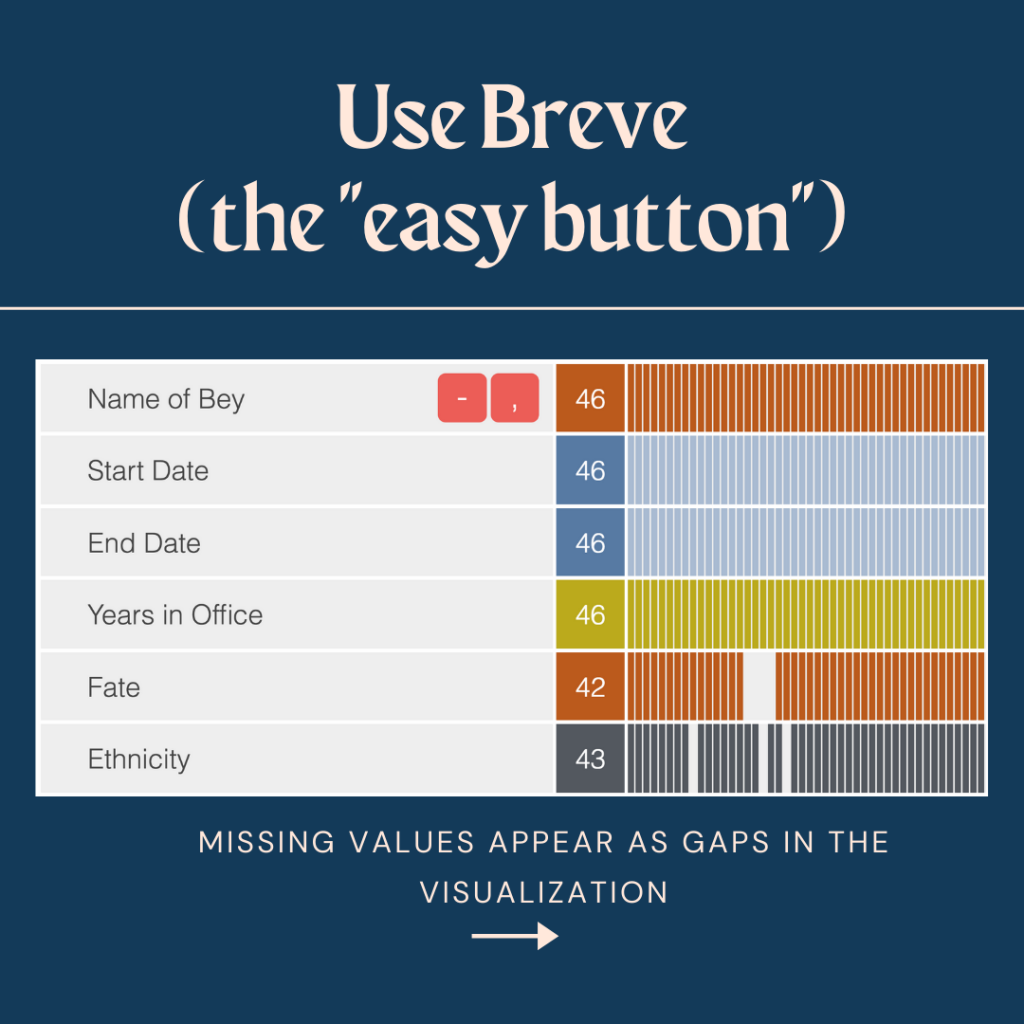
Grappling with missing values in data sets, determining what they mean, and deciding what we should do about them remain challenging tasks for anyone working with data. Here are a few suggestions, examples, and resources as you begin to explore silences in your own data.
Stay tuned for more from the Visualizing Hisotry’s Fragments project (forthcoming from Palgrave Macmillan)!
Additional Suggested Readings
D’Ignazio, Catherine, and Lauren F. Klein. Data Feminism. Ideas Series. Cambridge, MA: The MIT Press, 2020. https://data-feminism.mitpress.mit.edu/.
Klein, Lauren F. “The Image of Absence: Archival Silence, Data Visualization, and James Hemings.” American Literature 85, no. 4 (December 1, 2013): 661–88. https://doi.org/10.1215/00029831-2367310.
Schönpflug, Karin, Christine M. Klapeer, Roswitha Hofmann, and Sandra Müllbacher. “If Queers Were Counted: An Inquiry into European Socioeconomic Data on LGB(TI)QS.” Feminist Economics 24, no. 4 (October 2, 2018): 1–30. https://doi.org/10.1080/13545701.2018.1508877.