Data Visualization and Dashboards
I create easy to understand visualizations and dashboards to quickly convey meaning with accessibility in mind.
Dashboards
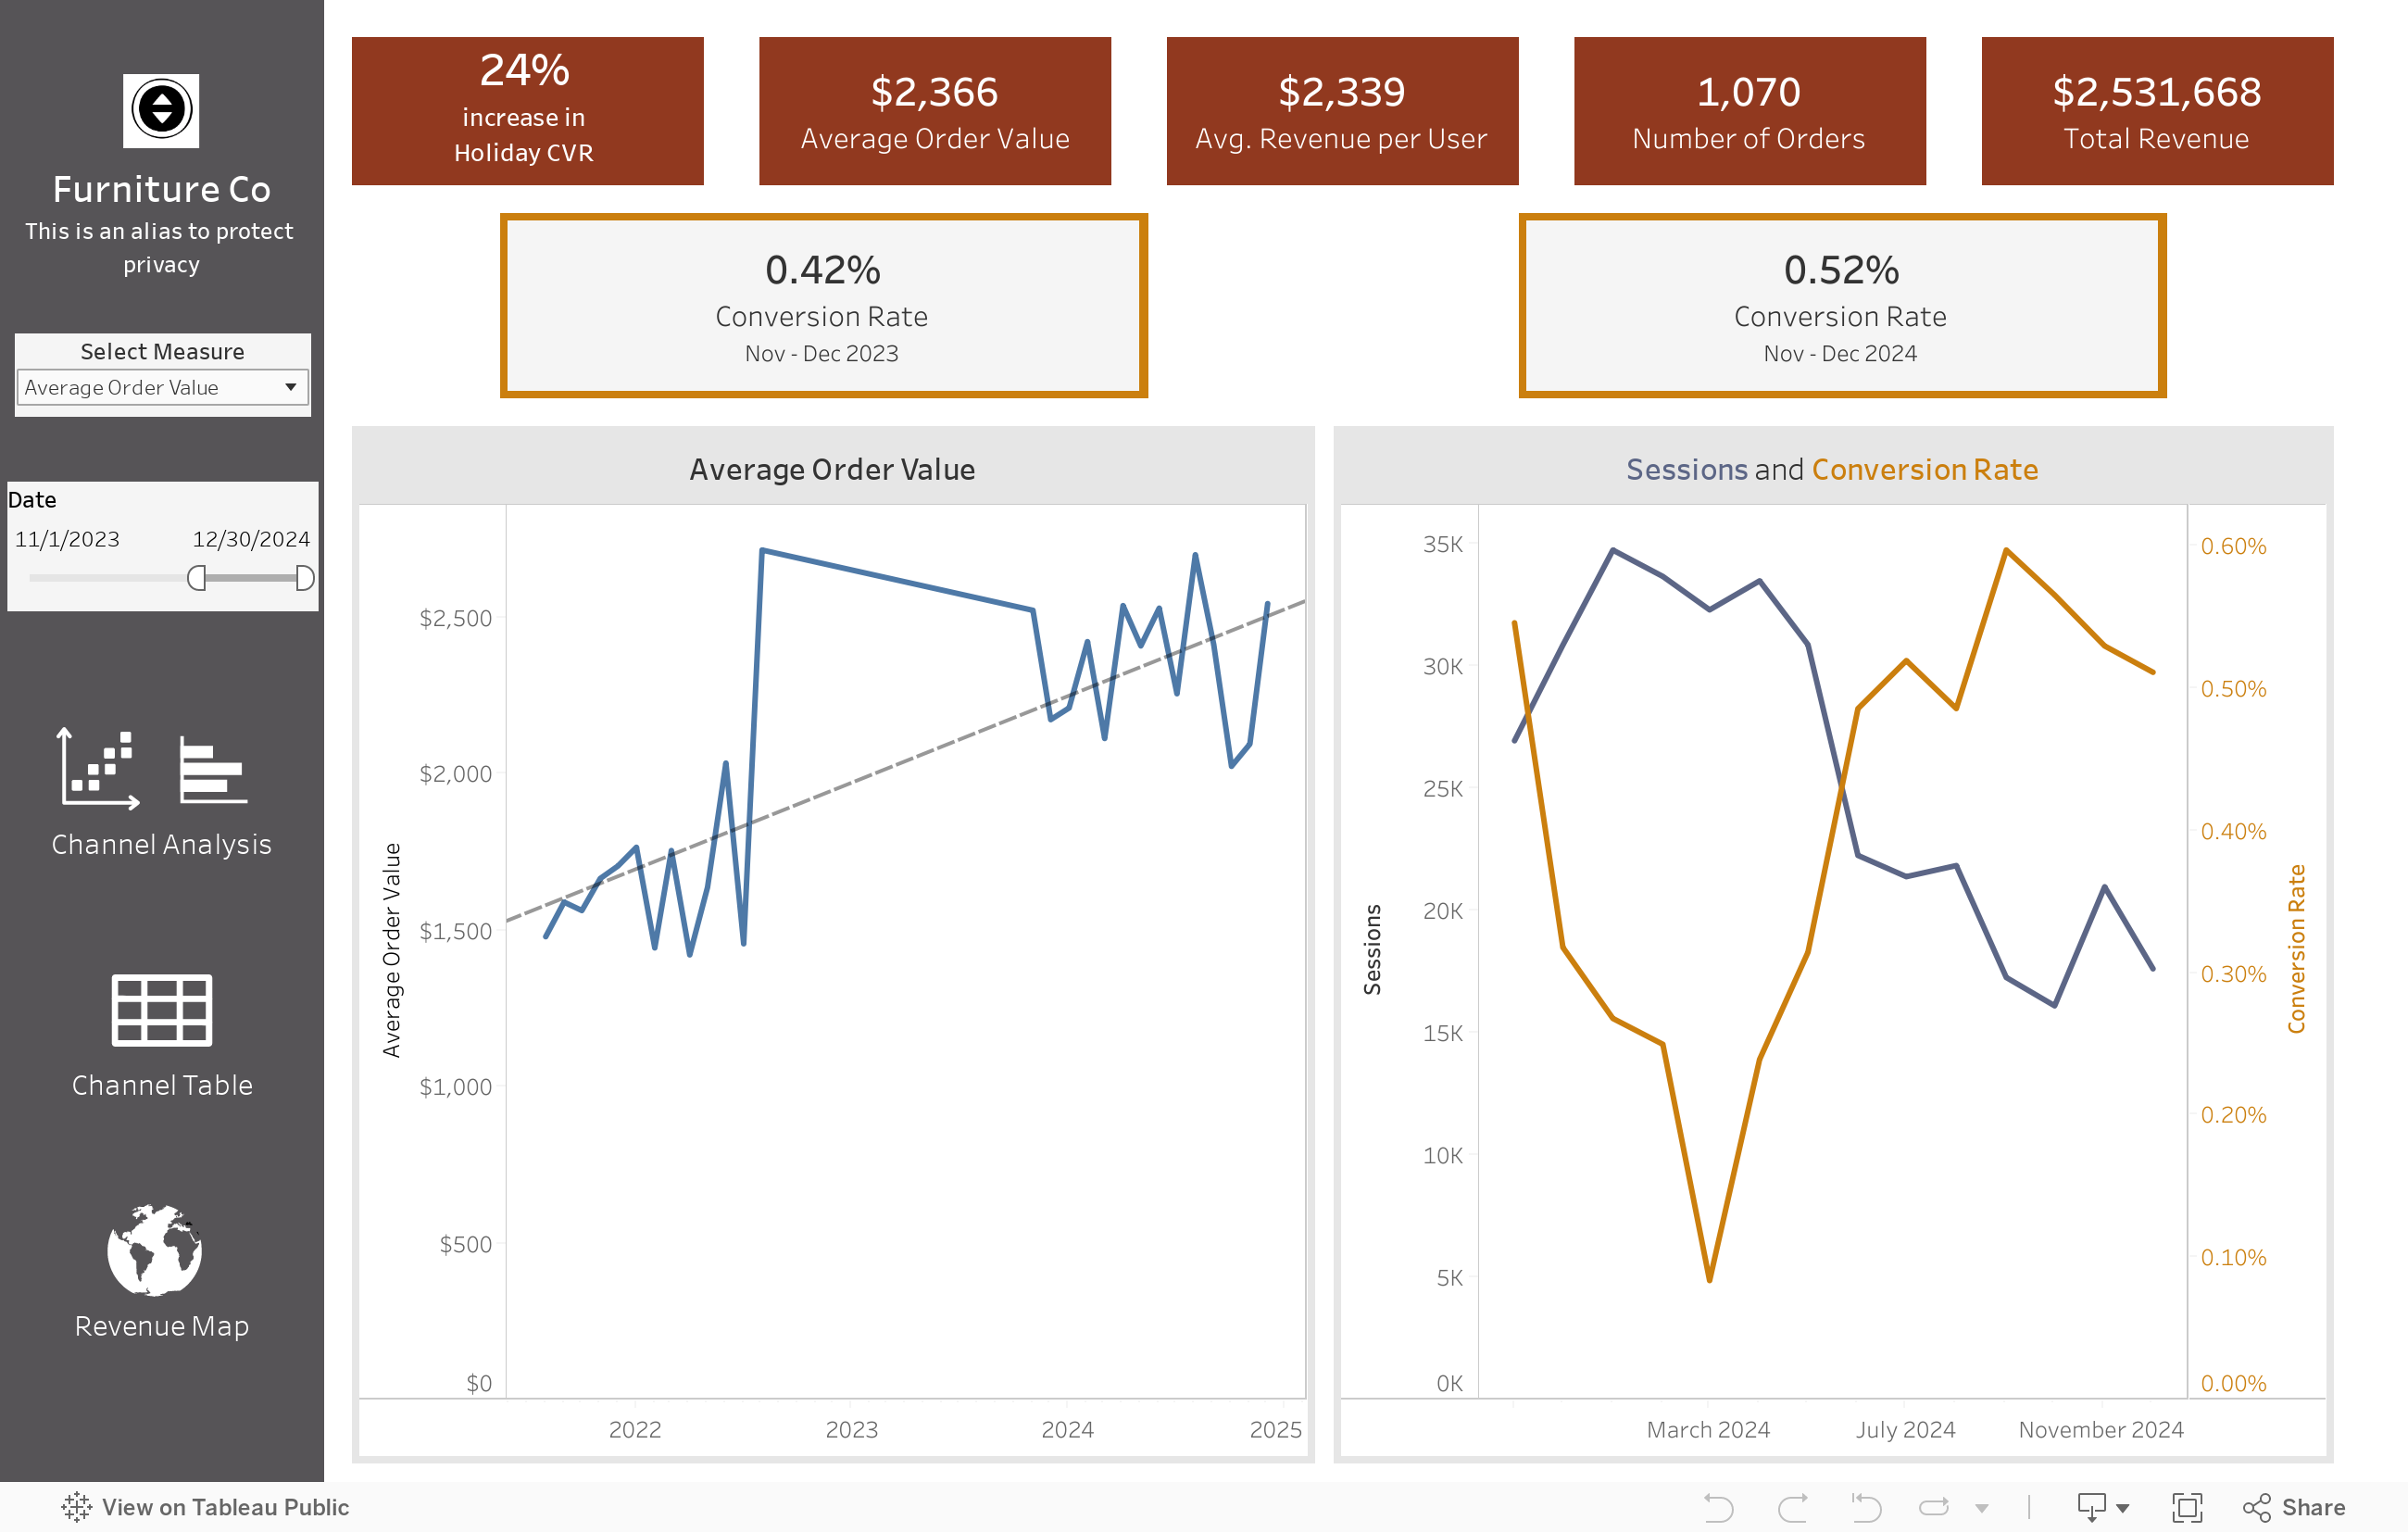
E-Commerce Analysis
Key Findings
I analyzed the impact of a website redesign for a high-end furniture producer. Despite a decline in overall revenue from the height of sales during the pandemic, I found a 24% increase in holiday sales conversion rates from 2023 to 2024 and a 72% increase in average order value, indicating that the redesign is driving more effective sales after people find the website and enabling my client to retain a profitable customer.
Actionable Insights
The analysis of conversion rates and revenue trends helped my client, the web designer, to retain the furniture company as profitable customer. Further exploration into marketing channel metrics also indicated that the company should focus on SEO optimization and exploring marketing ROI to improve channel performance and customer acquisition.
Explore the project below
Interact with the dashboard by selecting measures, dates, and various visualizations using the measure drop-down menu, data slider, and chart buttons in the left panel below. The dashboard color palette is consistent with the company’s own palette and branding.
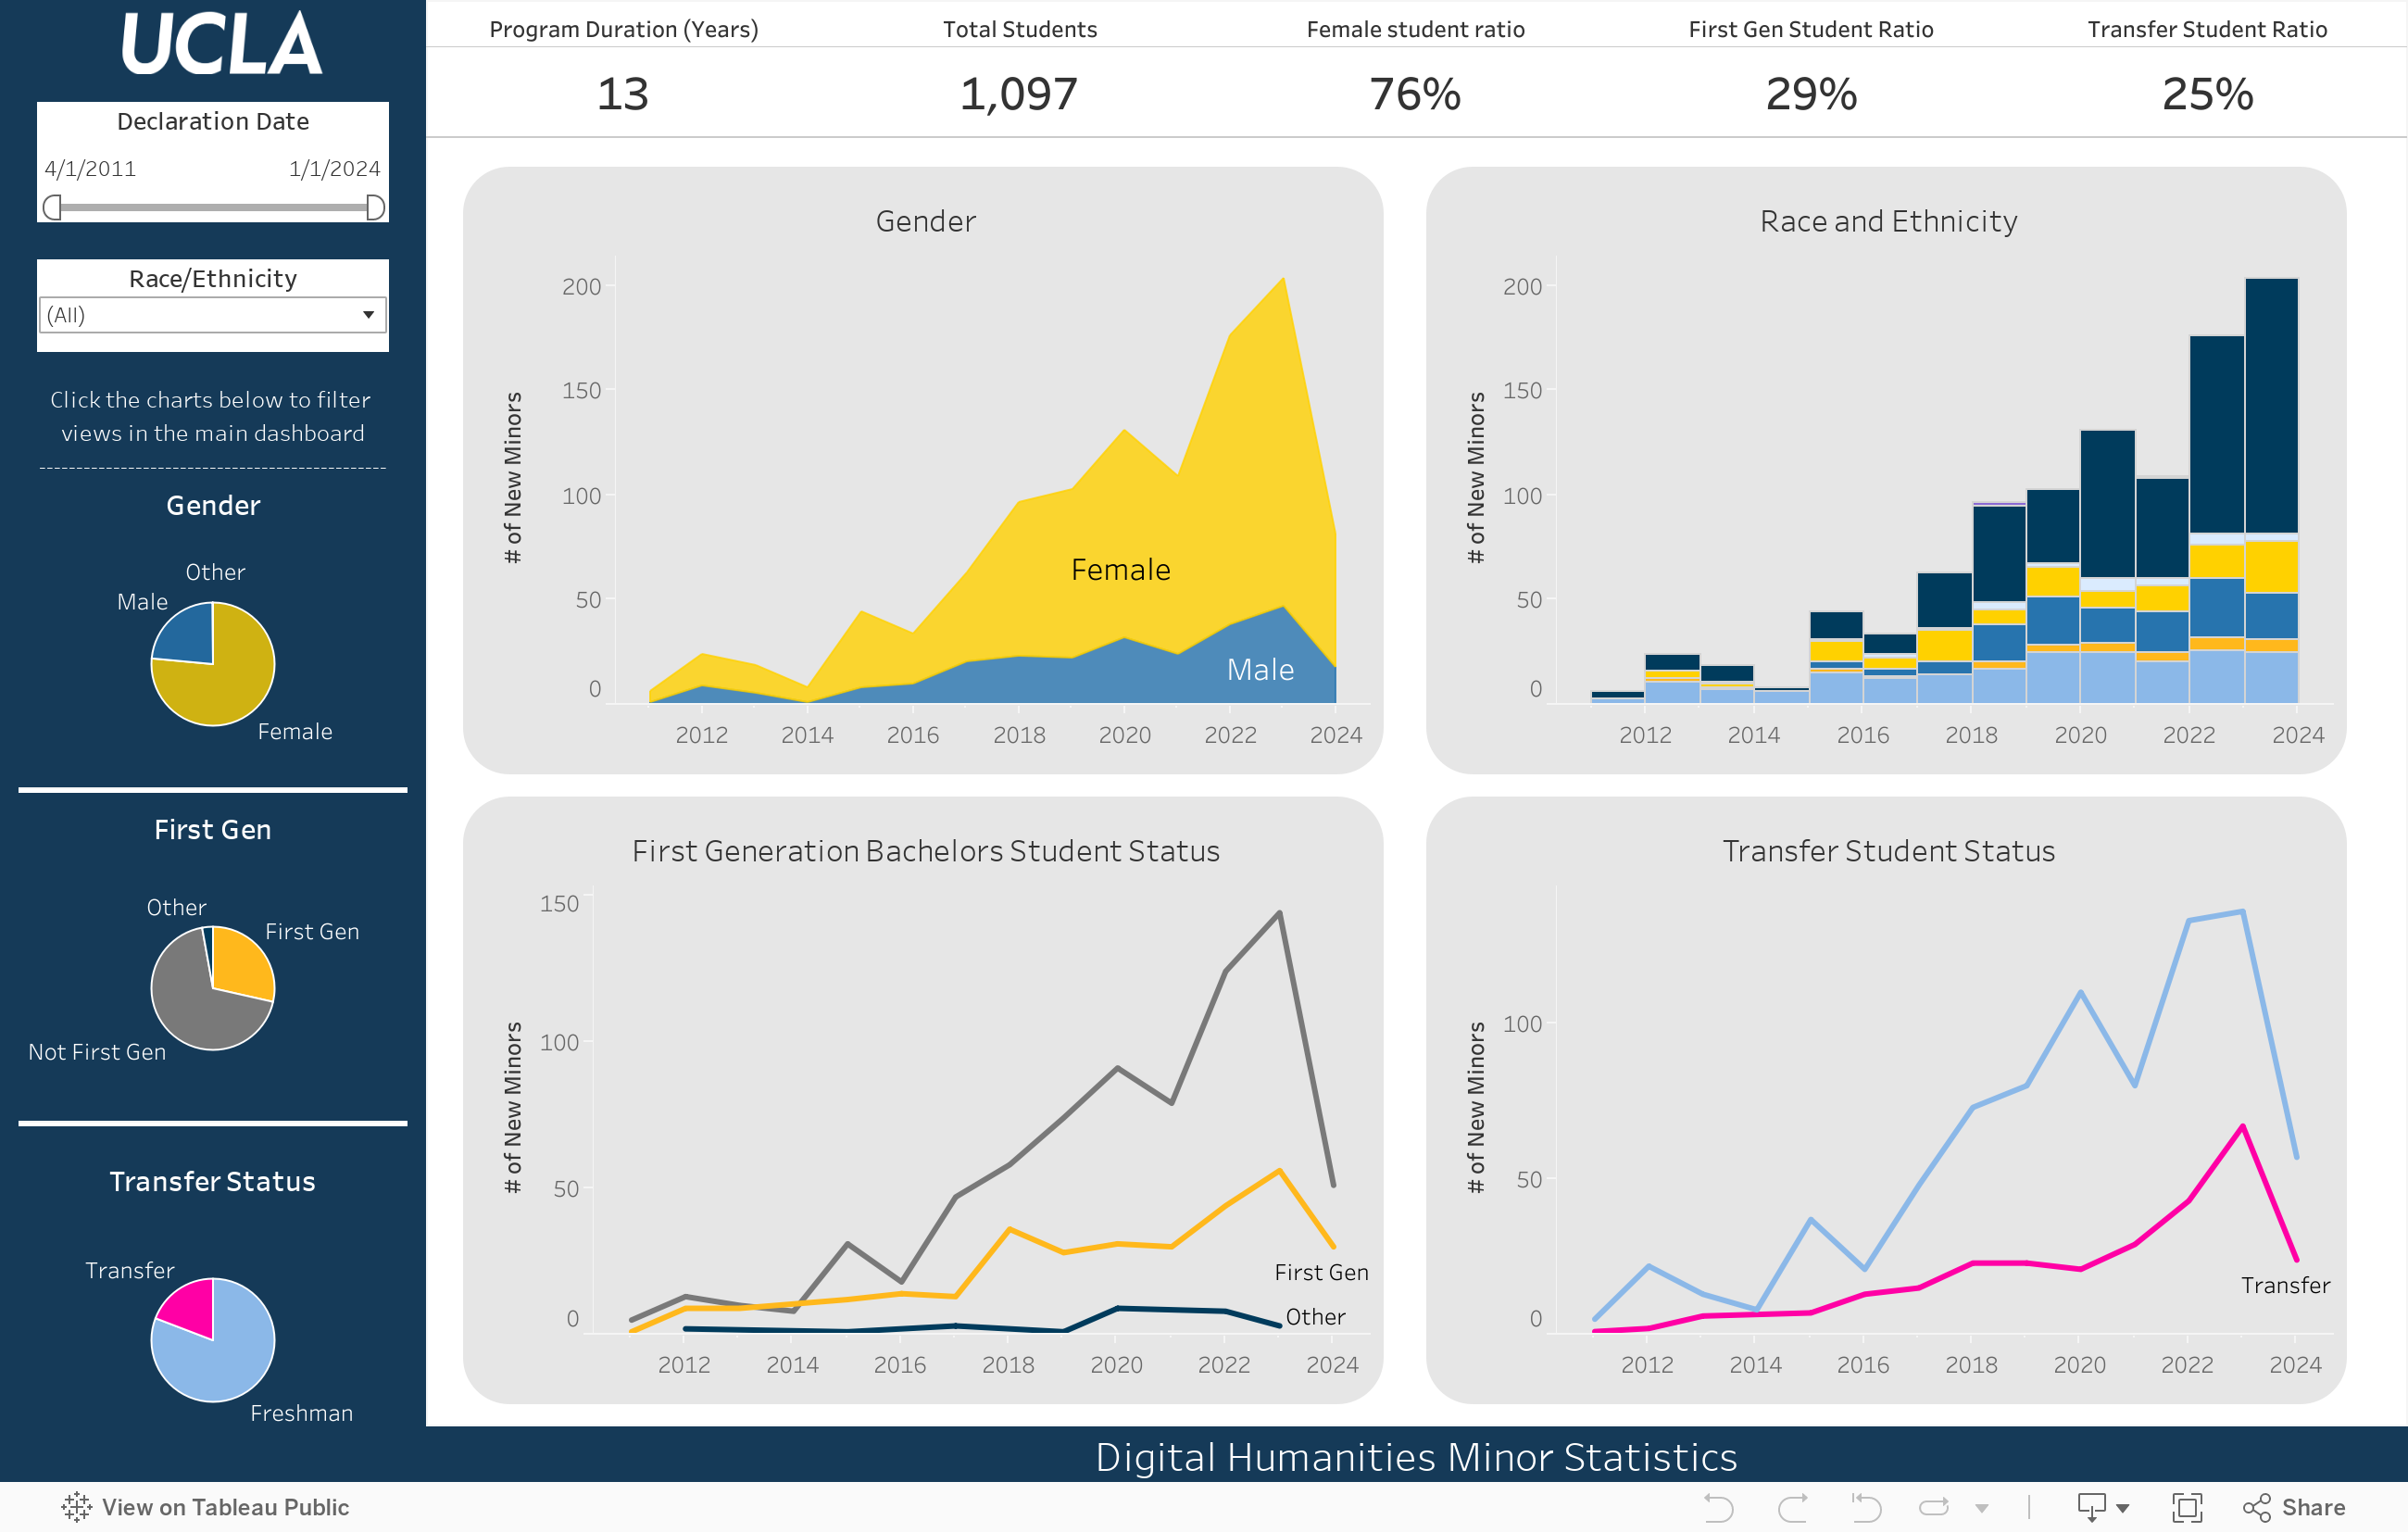
University of California, Los Angeles (UCLA)
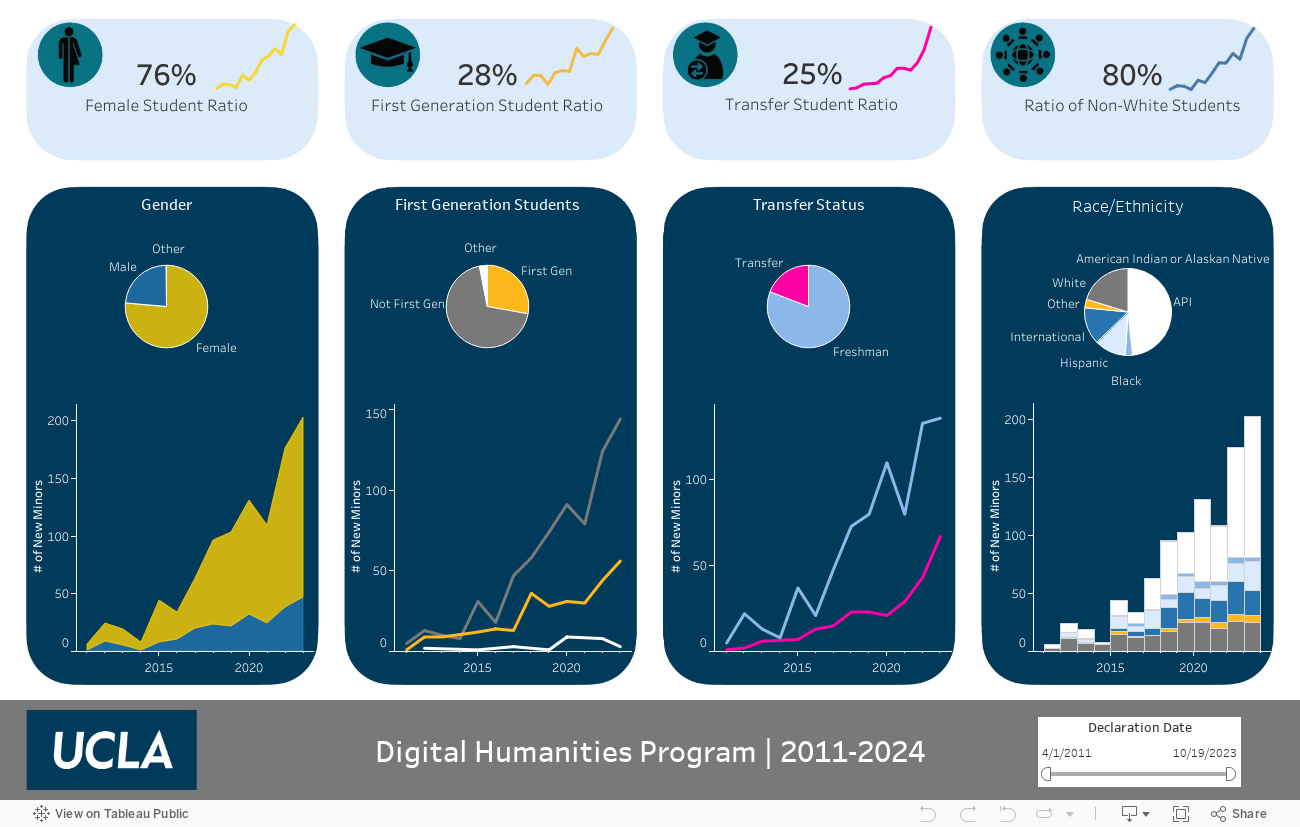
Enrollment Trends in the Digital Humanities Program | 2011-2024
The following two dashboards are meant to be viewed on computers or tablets. Mobile-ready dashboards based on the same data are still works in progress.
UCLA Digital Humanities Program Dashboard (Alternative Layout)
Data Infographics
A compilation of complex data visualizations, such as a network graph and sub-graph, and simple visualizations, such as stacked bar and circle charts, as well as a pictograph within an explanatory infographic to promote my book, Visualizing History’s Fragments (2024).