Data Visualization with Tableau
View the following videos to create more complex data visualizations, such as stacked timelines and Gantt charts, including mapping in Tableau. Follow along with the sample data linked below. Then
Read MoreView the following videos to create more complex data visualizations, such as stacked timelines and Gantt charts, including mapping in Tableau. Follow along with the sample data linked below. Then
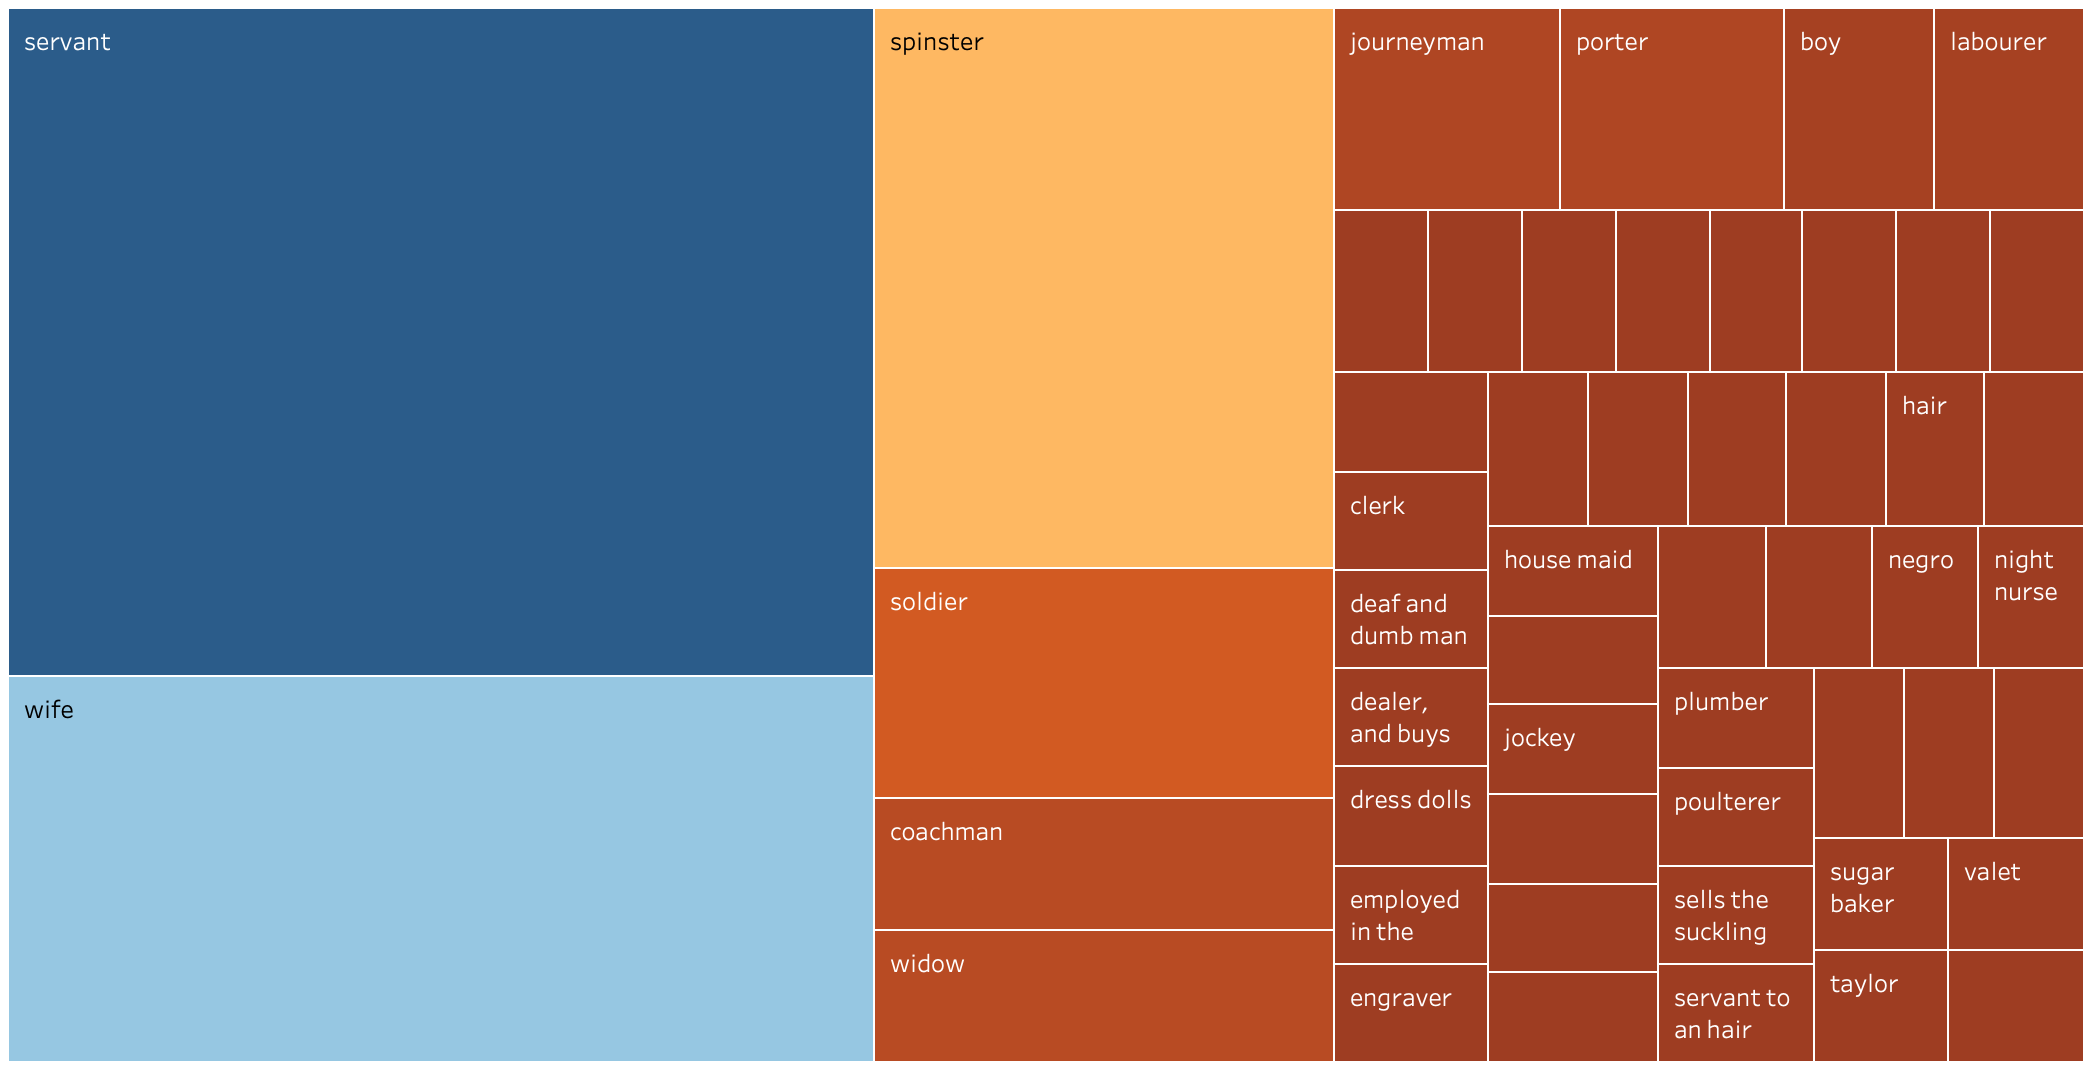
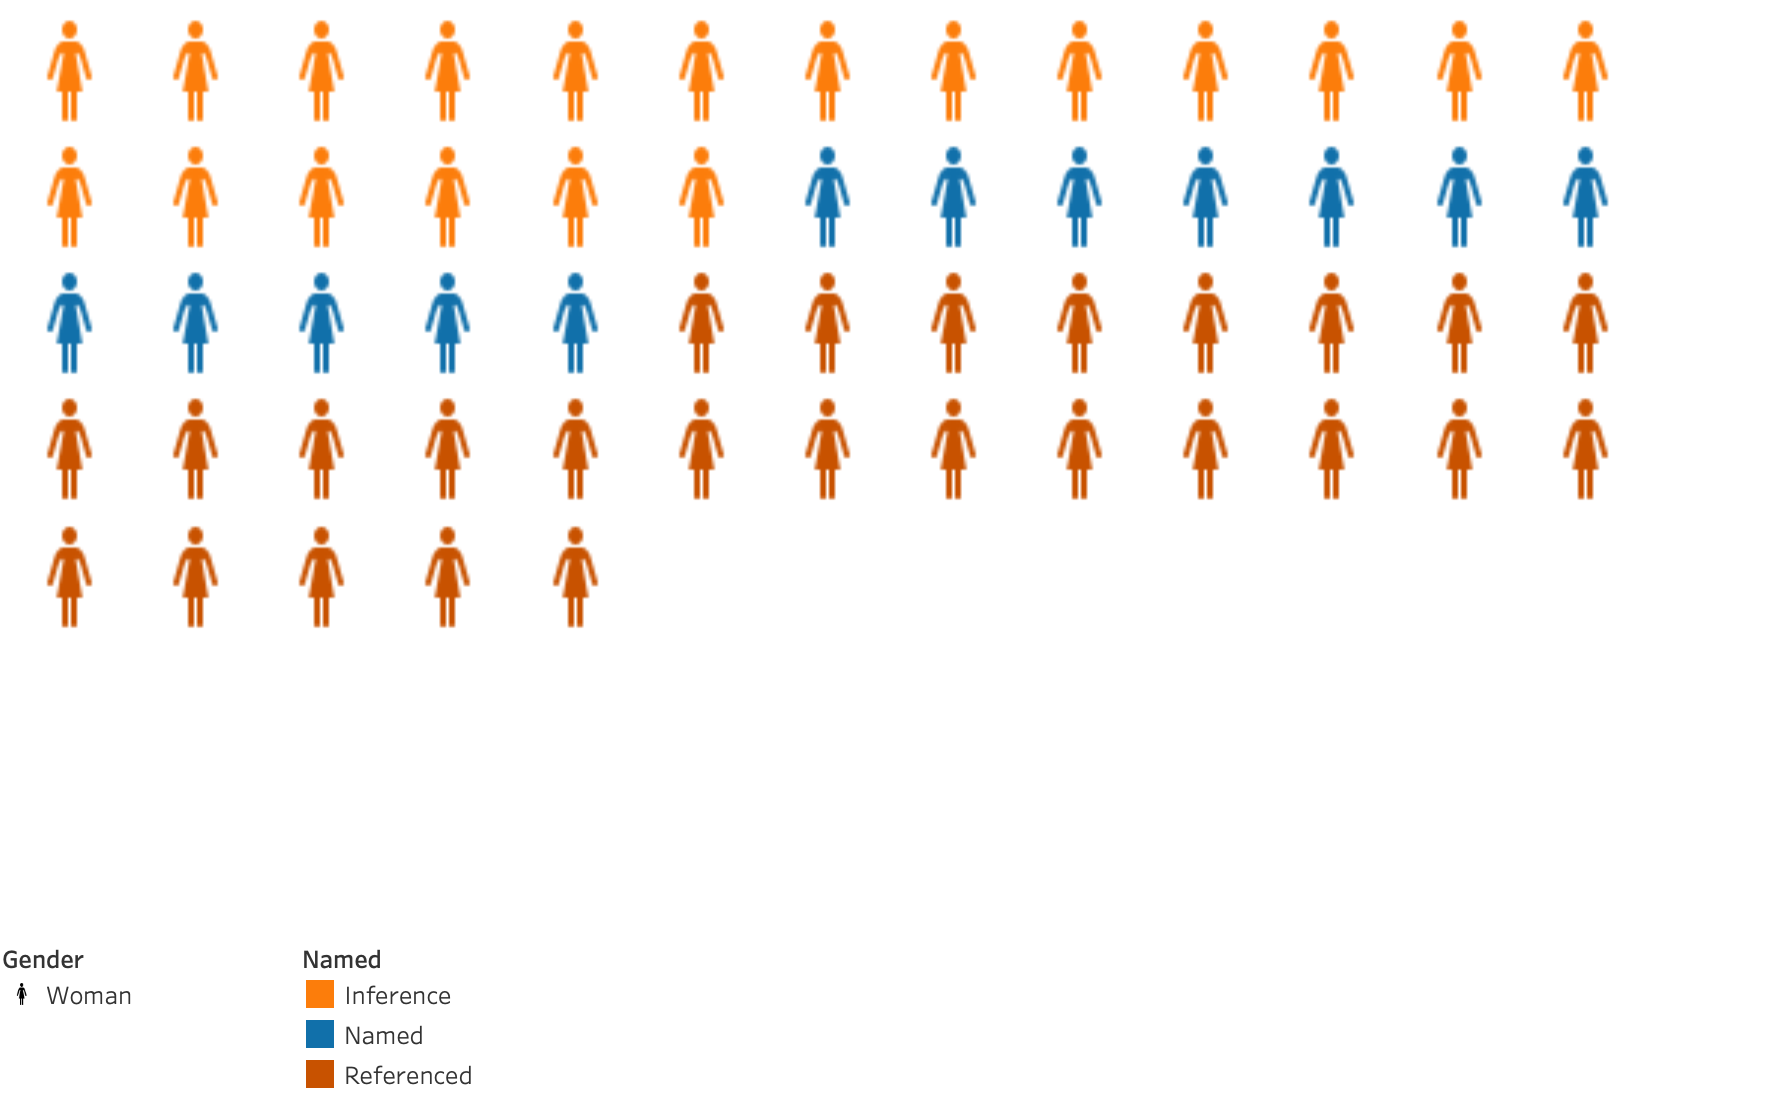
Read MoreIntroduction to data visualization with humanistic data from the Old Bailey Court records, focusing on defendants between 1780 and 1786. Sample visualizations include both categorical (nominal) and numeric data. Getting
Read More