Data Visualization with Tableau
View the following videos to create more complex data visualizations, such as stacked timelines and Gantt charts, including mapping in Tableau. Follow along with the sample data linked below. Then try it with your own data. Most importantly, consider what these visualizations mean in the context of your topic and data.
Data
- Data set 1: Data on the governors and socio-political networks of Ottoman Arab Provinces (16th-19th centuries)
- Data set 2: Native American birch bark canoes held at various museums around the world.
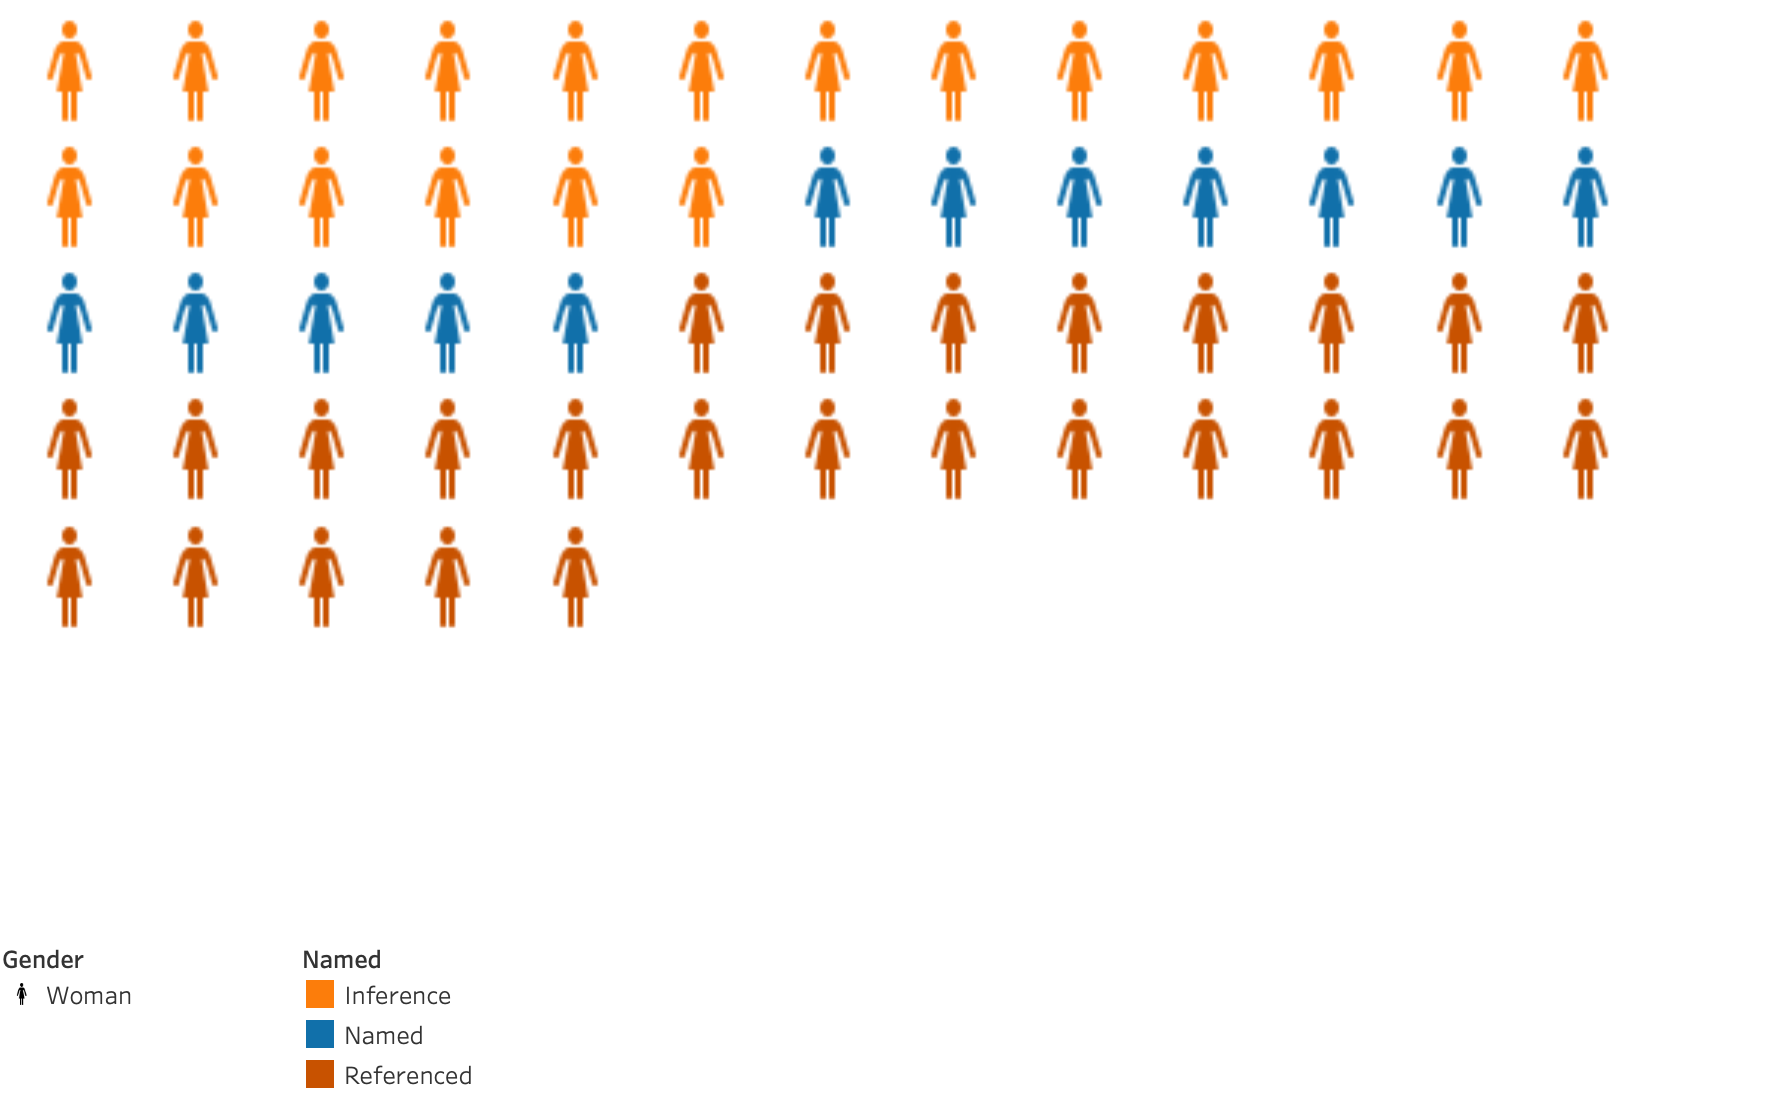
Pictographs
Data set 1: Data on the governors and socio-political networks of Ottoman Arab Provinces (16th-19th centuries)
Gantt
Data set 1: Data on the governors and socio-political networks of Ottoman Arab Provinces (16th-19th centuries)
Timeline
Data set 1: Data on the governors and socio-political networks of Ottoman Arab Provinces (16th-19th centuries)
Maps
Data set 2: Native American birch bark canoes held at various museums around the world.
Shapes
Data set 2: Native American birch bark canoes held at various museums around the world.